BinancemokuAn Ichimoku cloud indicator that uses the Binance moving averages (7, 25, 99) instead of the Ichimoku defaults of 9, 26, 52. Great for trading alts on the 4h but will work on any timeframe.
Also includes the Binance MA lines for comparison. They're hidden by default but you can enable them in settings and they'll show as fade lines.
Search in scripts for "Ichimoku Cloud"

Ichimoku With SignalsA variation on Ichimoku Cloud that has markers for strong/neutral/weak bullish/bearish signals.

Leo Crypto Multi-setting Ichimoku CloudEasily switch between Traditional, Crypto Single and Crypto Double Ichimoku Settings
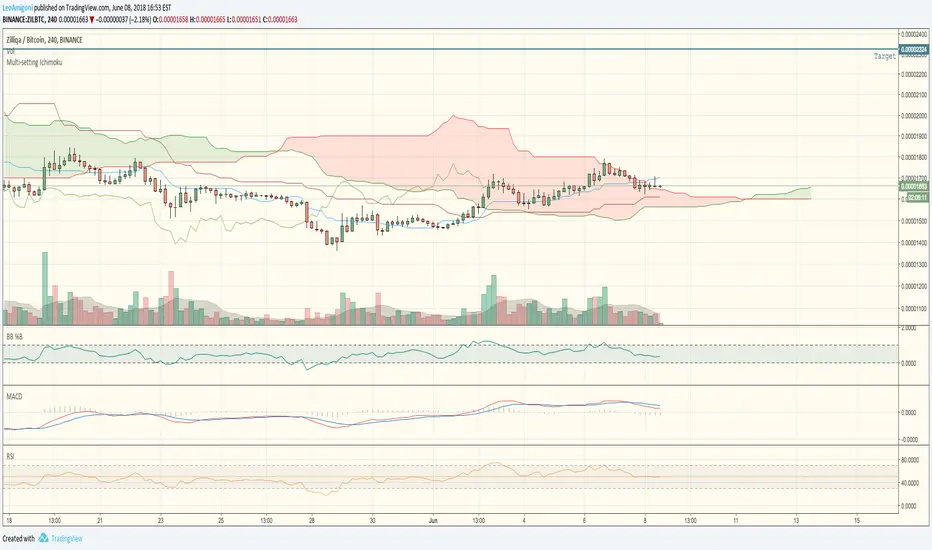


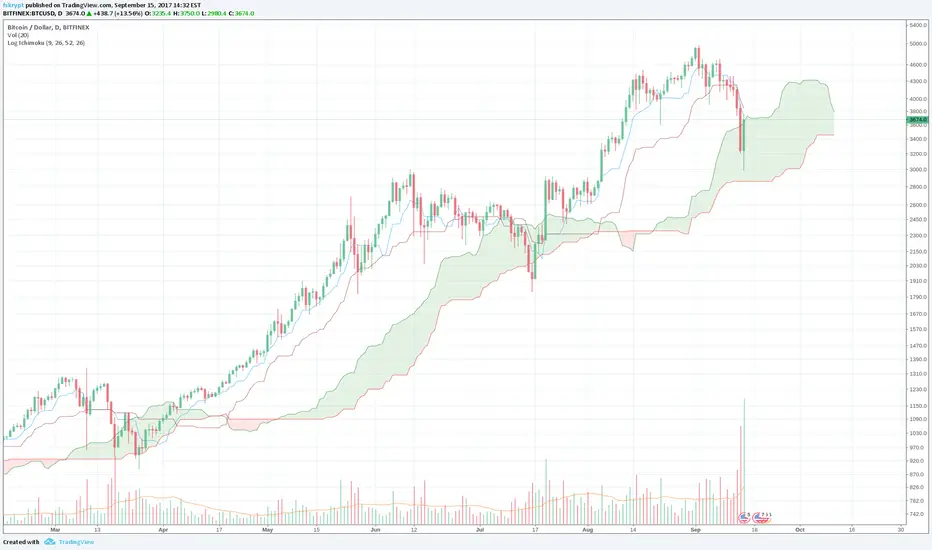
Log-space Ichimoku CloudThis indicator uses identical calculation to Ichimoku indicator except performed in log-space. This is helpful for long-term and highly volatile charts.
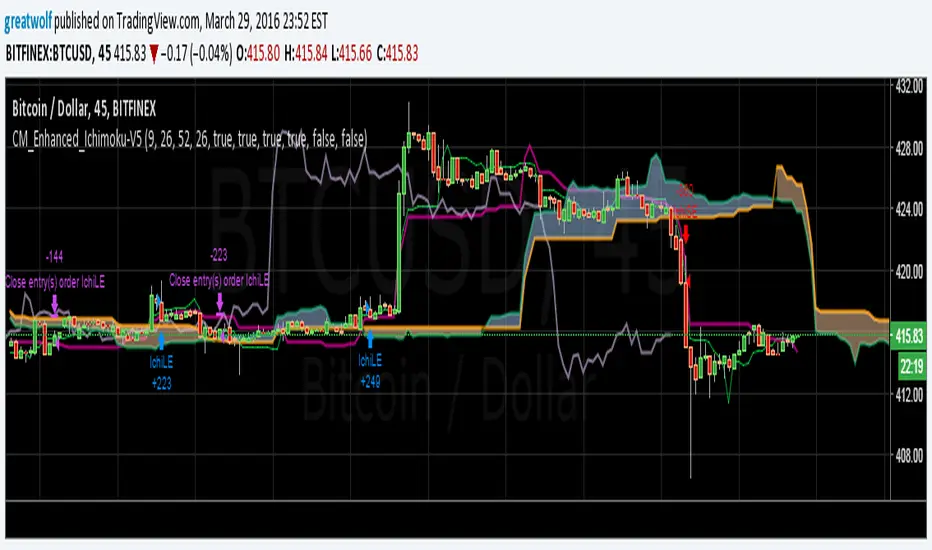
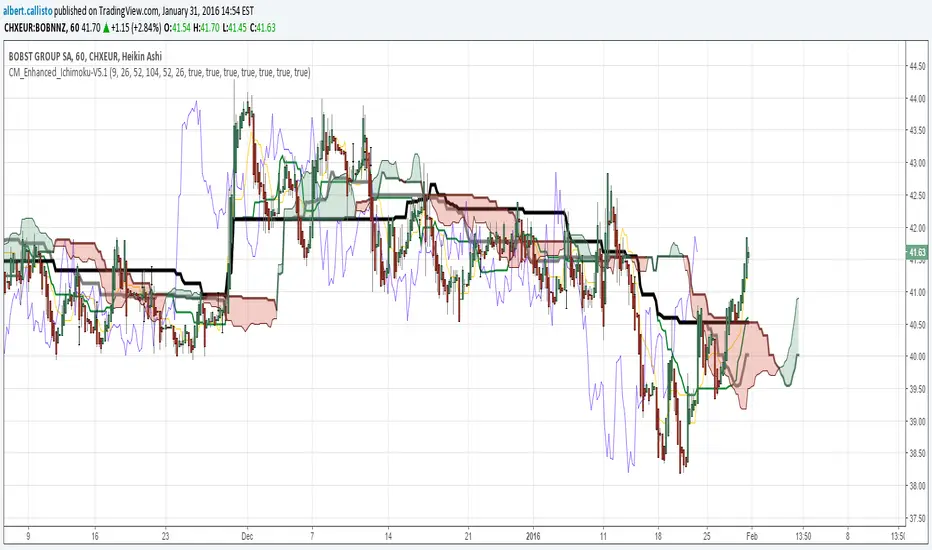
CM_Enhanced_Ichimoku Cloud-V5.1Based upon
Thanks Chris Moody !
Here are my changes, I looked at comments on the original page.
Thinner default lines, changed colors
Added options to add two extra Kijun with their own periods, useful to check resistance/support lines on different scales
Decreased height of arrows
[ZP] Fixed v6 testDISCLAIMER:
This indicator in Pine V6 as my first ever Tradingview indicator, has been developed for my personal trading analysis, consolidating various powerful indicators that I frequently use. A number of the embedded indicators within this tool are the creations of esteemed Pine Script developers from the TradingView community. In recognition of their contributions, the names of these developers will be prominently displayed alongside the respective indicator names. My selection of these indicators is rooted in my own experience and reflects those that have proven most effective for me. Please note that the past performance of any trading system or methodology is not necessarily indicative of future results. Always conduct your own research and due diligence before using any indicator or tool.
===========================================================================
Introducing the ultimate all-in-one DIY strategy builder indicator, With over 30+ famous indicators (some with custom configuration/settings) indicators included, you now have the power to mix and match to create your own custom strategy for shorter time or longer time frames depending on your trading style. Say goodbye to cluttered charts and manual/visual confirmation of multiple indicators and hello to endless possibilities with this indicator.
Available indicators that you can choose to build your strategy, are coded to seamlessly print the BUY and SELL signal upon confirmation of all selected indicators:
EMA Filter
2 EMA Cross
3 EMA Cross
Range Filter (Guikroth)
SuperTrend
Ichimoku Cloud
SuperIchi (LuxAlgo)
B-Xtrender (QuantTherapy)
Bull Bear Power Trend (Dreadblitz)
VWAP
BB Oscillator (Veryfid)
Trend Meter (Lij_MC)
Chandelier Exit (Everget)
CCI
Awesome Oscillator
DMI ( Adx )
Parabolic SAR
Waddah Attar Explosion (Shayankm)
Volatility Oscillator (Veryfid)
Damiani Volatility ( DV ) (RichardoSantos)
Stochastic
RSI
MACD
SSL Channel (ErwinBeckers)
Schaff Trend Cycle ( STC ) (LazyBear)
Chaikin Money Flow
Volume
Wolfpack Id (Darrellfischer1)
QQE Mod (Mihkhel00)
Hull Suite (Insilico)
Vortex Indicator

Swing Guardrail — 30-sec Midterm Check (EBITDA Margin & EV/EBITDWhat it does
Before a short-term swing entry, this indicator right-sizes positions by a quick midterm (3–12m) durability screen using two fundamentals:
EBITDA Margin (TTM) → earning power / operational resilience
EV/EBITDA (TTM) → price tag vs earning capacity (payback feel)
A high-contrast table (top-right) shows both metrics and a verdict:
PASS — both meet thresholds → normal size
HALF — only one meets → reduce size
FAIL — neither meets → avoid
Why check “midterm” for a short-term trade?
Short swings still face earnings/news gaps, failed breakouts, and regime shifts. Names with weak margins or stretched valuation tend to break faster and deeper. A 30-sec durability check helps you:
Filter fragile setups (avoid expensive + weakening names)
Stabilize drawdowns (size down when quality/price don’t align)
Keep timing unchanged while improving risk-adjusted returns
Inputs (defaults)
Min EBITDA Margin % (TTM): 8%
Max EV/EBITDA (TTM): 12
Dark chart? High-contrast colors
How to use with a swing system
Get your entry from price/volume (e.g., Ichimoku cloud break, Kijun reclaim, Tenkan>Kijun; or your A/B/C rules).
Run this check only to set size (not timing).
Optional alerts: Once per bar close for PASS / HALF / FAIL.
Size mapping & event guard
PASS → 100% of your planned size
HALF → ~50% size / tighter stops
FAIL → watchlist only
If earnings < ~10 JP business days, drop one tier; ≤3 days → avoid.
Sector guides (tweak as needed)
Software/Internet: Margin ≥ 15%, EV/EBITDA ≤ 18
Industrials/Consumer: Margin ≥ 8%, EV/EBITDA ≤ 12
Retail: Margin ≥ 5–7%, EV/EBITDA ≤ 10–12
Edge cases / substitutions
Banks/Insurers/REITs or net-cash/negative EBITDA: EV/EBITDA may mislead → consider Net Debt/EBITDA or sector metrics (CET1/LTV/DSCR).
Sparse data / fresh listings: numbers may be NA until updates.
Notes & limitations
Data via request.financial() (TTM/most-recent). Some tickers/regions can show NA until fundamentals refresh.
This is a risk-screen / sizing tool, not a buy/sell signal.
Disclaimer
Educational use only. Not investment advice.
日本語
タイトル
スイング用ガードレール―中期“壊れにくさ”30秒チェック(EBITDAマージン & EV/EBITDA, TTM)
概要
短期スイングのエントリー前に、中期(3〜12か月)の耐久性を2指標で素早く確認し、ポジションサイズを決めるためのツールです。
EBITDAマージン(TTM):事業の稼ぐ力・体力
EV/EBITDA(TTM):その体力に対する“値札”(回収年数の感覚)
右上の高コントラスト表に数値と判定を表示:
PASS:両方クリア → 通常サイズ
HALF:片方のみ → サイズ半分
FAIL:両方NG → 見送り
なぜ短期でも“中期”を確認?
短期でも決算・ニュースのギャップ、ブレイク失敗、地合い転換は起きます。マージンが弱い/割高すぎる銘柄は崩れやすく、戻りも鈍い傾向。30秒の耐久性チェックで
脆いセットアップを回避
ドローダウンを平準化(サイズで吸収)
タイミングは変えずに、リスク調整後リターンの改善を狙えます。
入力(既定)
最低EBITDAマージン:8%
最大EV/EBITDA:12
黒背景向け:高コントラスト表示
使い方(スイング手法と併用)
まずは価格シグナル(一目の雲上抜け/基準線回復/転換線>基準線、またはA/B/Cルール)。
本インジの判定でサイズのみ決定(エントリーのタイミングは出しません)。
任意でバー確定アラート(PASS/HALF/FAIL)を設定。
サイズ目安 & イベント抑制
PASS:計画サイズ100%
HALF:約50%(ストップもタイトに)
FAIL:見送り
決算まで≦10営業日なら1段階サイズダウン、≦3営業日は原則見送り。
セクター目安(調整推奨)
ソフト/ネット:マージン 15%以上、EV/EBITDA 18以下
工業/一般消費:マージン 8%以上、EV/EBITDA 12以下
小売:マージン 5〜7%以上、EV/EBITDA 10〜12以下
例外・代替
銀行・保険・REIT/ネットキャッシュ・EBITDAマイナス:EV/EBITDAは適さない場合 → Net Debt/EBITDAやCET1/LTV/DSCR等で補助。
新規上場・データ薄:更新までNAのことあり。
注意
データは request.financial() を使用。更新前はNAの可能性。
本ツールはリスク確認/サイズ調整用で、売買シグナルではありません。
免責
情報提供のみ。投資判断は自己責任で。

Trend Continuation Filter - 🚀 Trend Continuation Filter — Multi-Factor Overlay
This overlay plots bullish / bearish continuation labels & arrows only when the market has enough confluence behind the move. Think of it as your “trend gatekeeper” — cutting out weak setups and highlighting only those with real momentum + structure.
🔍 Built-in Filters
✔ Ichimoku Cloud → trend bias + Tenkan/Kijun confirmation
✔ MACD (12/26/9) → acceleration via histogram slope
✔ RSI / MFI (14) → momentum quality (≥60 bullish / ≤40 bearish)
✔ ADX (14) → strength check (≥20 and rising)
➕ EMA Alignment (9/21/55/233) (optional)
➕ ATR Slope (14) (optional)
🎯 How it works
✅ Prints a Bull Continuation label/arrow when ≥4 filters align to the upside
✅ Prints a Bear Continuation label/arrow when ≥4 filters align to the downside
⚙️ minChecks input lets you adjust the strictness:
• Normal Days → set to 4 (more frequent, flexible)
• Trend Days → raise to 5–6 (fewer, high-conviction setups)
📈 Best Practices
⏰ Focus on London & New York sessions for clean expectancy
🧩 Pair with a HUD/Dashboard panel to see exactly which filters are active

T-Virus Sentiment [hapharmonic]🧬 T-Virus Sentiment: Visualize the Market's DNA
Remember the iconic T-Virus vial from the first Resident Evil? That powerful, swirling helix of potential has always fascinated me. It sparked an idea: what if we could visualize the market's underlying health in a similar way? What if we could capture the "genetic code" of market sentiment and contain it within a dynamic, 3D indicator? This project is the result of that idea, brought to life with Pine Script.
The indicator's main goal is to measure the strength and direction of market sentiment by analyzing the "genetic code" of price action through a variety of trusted indicators. The result is displayed as a liquid level within a DNA helix, a bubble density representing buying pressure, and a T-Virus mascot that reflects the overall mood.
🧐 Core Concept: How It Works
The primary output of the indicator is the "Active %" gauge you see on the right side of the vial. This percentage represents the overall sentiment score, calculated as an average from 7 different technical analysis tools. Each tool is analyzed on every bar and assigned a score from 1 (strong bearish pressure) to 5 (strong bullish potential).
In this indicator, we re-imagine market dynamics through the lens of a viral outbreak. A strong bear market is like a virus taking hold, pulling all technical signals down into a state of weakness. Conversely, a powerful bull market is like an antiviral serum ; positive signals rise and spread toward the top of the vial, indicating that the system is being injected with strength.
This is not just another line on a chart. It's a comprehensive sentiment dashboard designed to give an immediate, at-a-glance understanding of the confluence between 7 classic technical indicators. The incredible 3D model of the vial itself was inspired by a design concept found here .
⚛️ The 4 Core Elements of T-Virus Sentiment
These four elements work in harmony to give a complete, multi-faceted picture of market sentiment. Each component tells a different part of the story.
The Virus Mascot: An instant emotional cue. This character provides the quickest possible read on the overall market mood, combining sentiment with volume pressure.
The Antiviral Serum Level: The main quantitative output. This is the liquid level in the DNA helix and the percentage gauge on the right, representing the average sentiment score from all 7 indicators.
Buy Pressure & Bubble Density: This visualizes volume flow. The density of bubbles represents the intensity of accumulation (buying) versus distribution (selling). It's the "power" behind the move.
The Signal Distribution: This shows the confluence (or dispersion) of sentiment. Are all signals bullish and clustered at the top, or are they scattered, indicating a conflicted market? The position of the indicator labels is crucial, as each is assigned to one of five distinct zones:
Base Bottom: The market is at its weakest. Signals here suggest strong bearish control and distribution.
Lower Zone: The market is still bearish, but signals may be showing early signs of accumulation or bottoming.
Neutral Core (Center): A state of balance or sideways consolidation. The market is waiting for a new direction.
Upper Zone: Bullish momentum is becoming clear. Signals are strengthening and showing bullish control.
Top Cap: The market is "heating up" with strong bullish sentiment, potentially nearing overbought conditions.
🐂🐻 The Virus Mascot: The At-a-Glance Indicator
This character acts as a shortcut to confirm market health. It combines the sentiment score with volume, preventing false confidence in a low-volume rally.
Its state is determined by a dual-check: the overall "Antiviral Serum Level" and the "Buy Pressure" must both be above 50%.
Green & Smiling: The 'all clear' signal. This means that not only is the overall technical sentiment bullish, but it's also being supported by real buying pressure. This is a sign of a healthy bull market.
Red & Angry: A warning sign. This appears if either the sentiment is weak, or a bullish sentiment is not being confirmed by buying volume. The latter could indicate a potential "bull trap" or an exhaustive move.
This mascot can be disabled from the settings page under "Virus Mascot Styling" if a cleaner look is preferred.
🫧 Bubble Density: Gauging Buy vs. Sell Pressure
The bubbles visualize the battle between buyers and sellers. There are two modes to control how this is calculated:
Mode 1: Visible Range (The 'Big Picture' View)
This default mode is best for getting a broad, contextual understanding of the current session. It dynamically analyzes the volume of every single candlestick currently visible on the screen to calculate the buy/sell pressure ratio. It answers the question: "Over the entire period I'm looking at, who is in control?" As you zoom in or out, the calculation adapts.
Mode 2: Custom Lookback (The 'Precision' View)
This mode is for traders who need to analyze short-term pressure. You can define a fixed number of recent bars to analyze, which is perfect for scalping or understanding the volume dynamics leading into a key level. It answers the question: "What is happening right now ?" In the example above, a lookback of 2 focuses only on the most recent action, clearly showing intense, immediate selling pressure (few bubbles) and a corresponding drop in the sentiment score to 29%.
ℹ️ Interactive Tooltips: Dive Deeper
We believe in transparency, not 'black box' indicators. This feature transforms the indicator from a visual aid into an active learning tool.
Simply hover the mouse over any indicator label (like EMA, OBV, etc.) to get a detailed tooltip. It will explain the specific data points and thresholds that signal met to be placed in its current zone. This helps build trust in the signals and allows users to fine-tune the indicator settings to better match their own trading style.
🎯 The Scoring Logic Breakdown
The "Antiviral Serum Level" gauge is the average score from 7 technical analysis tools. Each is graded on a 5-point scale (1=Strong Bearish to 5=Strong Bullish). Here’s a detailed, transparent look at how each "gene" is evaluated:
Relative Strength Index (RSI)
Measures momentum and overbought/oversold conditions.
Group 1 (Strong Bearish): RSI > 80 (Extreme Overbought)
Group 2 (Bearish): 70 < RSI ≤ 80 (Overbought)
Group 3 (Neutral): 30 ≤ RSI ≤ 70
Group 4 (Bullish): 20 ≤ RSI < 30 (Oversold)
Group 5 (Strong Bullish): RSI < 20 (Extreme Oversold)
Exponential Moving Averages (EMA)
Evaluates the trend's strength and structure based on the alignment of multiple EMAs (9, 21, 50, 100, 200, 250).
Group 1 (Strong Bearish): A perfect bearish sequence (9 < 21 < 50 < ...)
Group 2 (Bearish Transition): Early signs of a potential reversal (e.g., 9 > 21 but still below 50)
Group 3 (Neutral / Mixed): MAs are intertwined or showing a partial bullish sequence.
Group 4 (Bullish): A strong bullish sequence is forming (e.g., 9 > 21 > 50 > 100)
Group 5 (Strong Bullish): A perfect bullish sequence (9 > 21 > 50 > 100 > 200 > 250)
Moving Average Convergence Divergence (MACD)
Analyzes the relationship between two moving averages to gauge momentum.
Group 1 (Strong Bearish): MACD & Histogram are negative and momentum is falling.
Group 2 (Weakening Bearish): MACD is negative but the histogram is rising or positive.
Group 3 (Neutral / Crossover): A crossover event is occurring near the zero line.
Group 4 (Bullish): MACD & Histogram are positive.
Group 5 (Strong Bullish): MACD & Histogram are positive, rising strongly, and accelerating.
Average Directional Index (ADX)
Measures trend strength, not direction. The score is based on both ADX value and the dominance of DI+ vs DI-.
Group 1 (Bearish / No Trend): ADX < 20 and DI- is dominant.
Group 2 (Developing Bearish Trend): 20 ≤ ADX < 25 and DI- is dominant.
Group 3 (Neutral / Indecision): Trend is weak or DI+ and DI- are nearly equal.
Group 4 (Developing Bullish Trend): 25 ≤ ADX ≤ 40 and DI+ is dominant.
Group 5 (Strong Bullish Trend): ADX > 40 and DI+ is dominant.
Ichimoku Cloud (IKH)
A comprehensive indicator that defines support/resistance, momentum, and trend direction.
Group 1 (Strong Bearish): Price is below the Kumo, Tenkan < Kijun, and Chikou is below price.
Group 2 (Bearish): Price is inside or below the Kumo, with mixed secondary signals.
Group 3 (Neutral / Ranging): Price is inside the Kumo, often with a Tenkan/Kijun cross.
Group 4 (Bullish): Price is above the Kumo with strong primary signals.
Group 5 (Strong Bullish): All signals are aligned bullishly: price above Kumo, bullish Tenkan/Kijun cross, bullish future Kumo, and Chikou above price.
Bollinger Bands (BB)
Measures volatility and relative price levels.
Group 1 (Strong Bearish): Price is below the lower band.
Group 2 (Bearish Territory): Price is between the lower band and the basis line.
Group 3 (Neutral): Price is hovering around the basis line.
Group 4 (Bullish Territory): Price is between the basis line and the upper band.
Group 5 (Strong Bullish): Price is above the upper band.
On-Balance Volume (OBV)
Uses volume flow to predict price changes. The score is based on OBV's trend and its position relative to its moving average.
Group 1 (Strong Bearish): OBV is below its MA and falling.
Group 2 (Weakening Bearish): OBV is below its MA but showing signs of rising.
Group 3 (Neutral): OBV is very close to its MA.
Group 4 (Bullish): OBV is above its MA and rising.
Group 5 (Strong Bullish): OBV is above its MA, rising strongly, and showing signs of a volume spike.
🧭 How to Use the T-Virus Sentiment Indicator
IMPORTANT: This indicator is a sentiment dashboard , not a direct buy/sell signal generator. Its strength lies in showing confluence and providing a quick, holistic view of the market's technical health.
Confirmation Tool: Use the "Active %" gauge to confirm a trade setup from your primary strategy. For example, if you see a bullish chart pattern, a high and rising sentiment score can add confidence to your trade.
Momentum & Trend Gauge: A consistently high score (e.g., > 75%) suggests strong, established bullish momentum. A consistently low score (< 25%) suggests strong bearish control. A score hovering around 50% often indicates a ranging or indecisive market.
Divergence & Warning System: Pay attention to divergences. If the price is making new highs but the sentiment score is failing to follow or is actively decreasing, it could be an early warning sign that the underlying momentum is weakening.
⚙️ Settings & Customization
The indicator is highly customizable to fit any trading style.
Position & Anchor: Control where the vial appears on the chart.
Styling (Vial, Helix, etc.): Nearly every visual element can be color-customized.
Signals: This is where the real power is. All underlying indicator parameters (RSI length, MACD settings, etc.) can be fine-tuned to match a personal strategy. The text labels can also be disabled if the chart feels cluttered.
Enjoy visualizing the market's DNA with the T-Virus Sentiment indicator

Zero Lag MACD + Kijun-sen + EOM StrategyThis strategy offers a robust approach to identifying high-probability trading opportunities in the fast-paced cryptocurrency markets, particularly on lower timeframes (e.g., 5-minute). It leverages the synergistic power of three distinct indicators to confirm entries, ensuring a disciplined approach to risk management.
Key Components:
Zero Lag MACD Enhanced Version 1.2: This core momentum indicator is used to identify precise shifts in trend and momentum, offering reduced lag compared to traditional MACD. Entry signals are filtered based on the histogram's position (below for buys, above for sells) to enhance signal reliability.
Kijun-sen (Ichimoku Cloud): Acting as a dynamic support/resistance and trend filter, the Kijun-sen line confirms the prevailing market direction. Long entries are confirmed when price is above Kijun-sen, and short entries when price is below.
Ease of Movement (EoM): This volume-based oscillator provides crucial confirmation of price movements by measuring the ease with which price changes. Positive EoM confirms buying pressure, while negative confirms selling pressure, adding an essential layer of validation to trade setups.
How it Works:
The strategy generates entry signals only when all three indicators align simultaneously:
For Long Entries: A Zero Lag MACD buy signal (crossover below histogram) must coincide with price trading above the Kijun-sen, and the Ease of Movement indicator being above its zero line.
For Short Entries: A Zero Lag MACD sell signal (crossover above histogram) must coincide with price trading below the Kijun-sen, and the Ease of Movement indicator being below its zero line.
Entries are executed at the open of the candle immediately following the signal confirmation.
Risk Management:
Disciplined risk management is paramount to this strategy:
Dynamic Stop-Loss: An Average True Range (ATR) based stop-loss is implemented, set at 2.5 times the current ATR. This adapts the stop-loss distance to market volatility, ensuring sensible risk sizing.
Fixed Take-Profit: A consistent Risk-to-Reward (R:R) ratio of 1:1.2 is applied for all trades, promoting stable profit realization.
Customization & Optimization:
The strategy is built with fully customizable input parameters for each indicator (MACD lengths, Kijun-sen period, ATR period, ATR multiplier, and Risk-to-Reward ratio). This allows users to fine-tune the strategy for different assets, timeframes, and market conditions, facilitating robust backtesting and optimization.
Disclaimer: Trading involves substantial risk and is not suitable for all investors. Past performance is not indicative of future results. This strategy is provided for educational and informational purposes only. Always use proper risk management and conduct your own due diligence.

*2.2 Aggregated (Raw Z-scores with MA)***To be used with other 2.2 indicator***
Key Indicators Used:
Oscillating Indicators: RSI, TSI, Stochastic, MACD, CCI, Vortex Indicator, Williams %R.
Perpetual Trend Indicators: EMA, ADX, Parabolic SAR, Supertrend, Donchian Channel, Ichimoku Cloud, RVGI.
How to Use the Indicator:
Raw Z-Score (Blue Line): This represents the real-time aggregated Z-score of all the indicators. It shows how far the current market conditions are from their average, helping you identify trends.
Moving Average of Z-Score (Orange Line): A smoothed version of the Z-score that helps confirm trends and eliminate noise.
Shaded Area: The area between the Z-score and its moving average is shaded green if the Z-score is above the moving average (bullish), and red if below the moving average (bearish).
Zero Line (Gray Line): Serves as a reference point. A Z-score crossing above zero could signal a bullish market, while crossing below zero could indicate bearish conditions.
This indicator helps in identifying market extremes and trend reversals by combining various technical indicators into a single aggregate score, ideal for spotting overbought or oversold conditions and possible trend shifts

Kijun_ATROVERVIEW
Kijun + ATR is an indicator that combines Lagging Kijun Base Line From Ichimoku Cloud (direction indicator) and Volatility Indicator ATR.
By combining ATR with kijun we can filter out noise from Base Line.
CALCULATIONS
Kijun is calculated by taking average of lowest and highest point of price over set lenght.
ATR is just default Tradingview Indicator that calculates average true range of price over set period of time.
WORKING
When both close > lower and not close < upper are true indicator indicate long by color limeand indicates short when close < upper by color fuchsia (Color can be changed in settings)
Indicator works best in Trending Market Regimes can have problems by signaling tops in Consolidating Market Regimes during bear markets and by sygnaling bottom in short consolidating market regimes during bull market.

CVD with Moving Average (Trend Colors) [SYNC & TRADE]Yesterday I wrote a simple and easy code for the indicator "Cumulative Delta Volume with a moving average" using AI.
Introduction:
Delta is the difference between buys and sells. If there are more purchases, the delta is positive, if there are more sales, the delta is negative. We look at each candle separately on a particular time frame, which does not give us an overall picture over time.
Cumulative volume delta is in many ways an extension of volume delta, but it covers longer periods of time and provides different trading signals. Like the volume delta indicator, the Cumulative Volume Delta (CVD) indicator measures the relationship between buying and selling pressure, but does not focus on one specific candle (or other chart element), but rather gives a picture over time.
What did you want to get?
I have often seen that they tried to attach RSI and the Ichimoku cloud to the cumulative delta of volume, but I have never seen a cumulative delta of volume with a moving average. A moving average that takes data from the cumulative volume delta will be different from the moving average of the underlying asset. It has been noted that often at the intersection of the cumulative volume delta and the moving average, this is a more accurate signal to buy or sell than the same intersections for the underlying asset.
Initially, 5 moving averages were made with values of 21, 55, 89, 144 and 233, but I realized that this overloads the chart. It is easier to change the length of the moving average depending on the time frame you are using than to overload the chart. The final version with one moving SMA, EMA, RMA, WMA, HMA.
The logic for applying a moving average to a cumulative volume delta:
You choose a moving average, just like you would on your underlying asset. Use the moving average you like and the period you are used to working with. Each TF has its own settings.
What we see on the graph:
This is not an oscillator, but an adapted version for a candlestick chart (line only). Using it, you can clearly see where the market is moving based on the cumulative volume delta. The cool thing is that you can include your moving average applied to the cumulative volume delta. Thanks to this, you can see a trend movement, a return to the moving average to continue the trend.
Opportunities not lost:
The most interesting thing is that it remains possible to observe the divergence of the asset and the cumulative delta of the volume. This gives a great advantage. Those who have not worked with divergence do not rush into it right away. There may be 3 peaks in divergence (as with oversold/overbought), but it works many times more clearly than RSI and MACD.
Here's a good example on the daily chart. The moment we were all waiting for 75,000. The cumulative Delta Volume fell with each peak, while the price chart (tops) were approximately level.
Usually they throw (allow to buy) without volume for sales (delta down, price up) in order to merge at a more interesting price. And they also drain without the volume of purchases for a squeeze (price down / delta up) and again I buy back at a more interesting price. There are more complex estimation options; you can read about the divergence of the cumulative delta of the CVD volume. I just recommend doing a backtest.
Recommendations:
One more moment. Use the indicator on the stock exchange, where there is the most money, by turnover and by asset. Choose Binance, not Bybit. Those. choose the BTC asset, for example, but on the Binance exchange. Not futures, but spot.
The greater the turnover on the exchange for an asset, and the fewer opportunities to enter with leverage, the less volatile the price and the more beautiful and accurate the chart.
Works on all assets. There is a subscription limit (the number of calculated bars) that has little effect on anything. Can be applied to any asset where there is volume (not SPX, but ES1, not MOEX, but MX1!).
Перевод на русский.
Вчера написал с помощью AI простой и легкий код индикатора "Кумулятивная Дельта Объема со скользящей средней".
Введение:
Дельта (Delta) — это разница между покупками и продажами. Если покупок больше — дельта положительная, если больше продаж — дельта отрицательная. Мы смотрим на каждую свечу отдельно на том или ином таймфрейме, что не дает нам общей картины во времени.
Кумулятивная дельта объема — во многом продолжение дельты объёмов, но она включает более длительные периоды времени и дает другие торговые сигналы. Как и индикатор дельты объёма, индикатор кумулятивной дельты объема (Cumulative Volume Delta, CVD) измеряет связь между давлением покупателей и продавцов, но при этом не фокусируется на одной конкретной свече (или другом элементе графика), а дает картину во времени.
Что хотел получить?
Часто видел, что к кумулятивной детьте объема пытались прикрепить RSI и облако ишимоку, но никогда не видел кумулятивную дельту объема со скользящей средней. Скользящая средняя которая берет данные от кумулятивной дельты объема будет отличатся от скользящей средней основного актива. Было замечено, что часто в местах пересечения кумулятивной дельты объема и скользящей средней - это более точный сигнал к покупке или продаже, чем такие же пересечения по основному активу.
Изначально было сделанно 5 скользящих со значениями 21, 55, 89, 144 и 233, но я понял, что это перегружает график. Проще менять длину скользящей средней от используемого таймфрейма, чем перегружать график. Финальный вариант с одной скользящей SMA, EMA, RMA, WMA, HMA.
Логика применения скользящей средней к кумулятивной дельте объема:
Вы выбираете скользящую среднюю, так же как и на основном активе. Применяйте ту скользящую среднюю, которая вам нравится и период, с которым привыкли работать. На каждом TF свои настройки.
Что мы видим на графике:
Это не осциллятор, а адаптированная версия к свечному графику (только линия). С помощью него вы можете наглядно посмотреть куда движется рынок по кумулятивной дельте объема. Самое интересное, что вы можете включить свою скользящую среднюю, применимую к кумулятивной дельте объема. Благодаря этому вы можете видеть трендовое движение, возврат к средней скользящей для продолжения тренда.
Не потерянные возможности:
Самое интересное, что осталась возможность наблюдать за дивергенцией актива и кумулятивной дельтой объема. Это дает большое преимущество. Те кто не работал с дивергенцией не бросайтесь на нее сразу. Может быть и 3 пика в дивергенции (как с перепроданностью / перекупленностью), но работает в разы четче чем RSI и MACD.
Вот хороший пример на дневном графике. Момент когда мы все ждали 75000. Кумулятивная Дельта Объема падала с каждым пиком, в то время как ценовой график (вершины) были примерно на уровне.
Обычно закидывают (разрешают покупать) без объема на продажи (дельта вниз цена вверх), чтобы слить по более интересной цене. И также сливают без объема покупок для сквиза (цена вниз / дельта вверх) и опять откупаю по более интересной цене. Существуют более сложные варианты оценки, можете почитать про дивергенцию кумулятивной дельты объема CVD. Только рекомендую сделать бэктест.
Рекомендации:
Еще момент. Используйте индикатор, на бирже, там где больше всего денег, по обороту и по активу. Выбирайте не Bybit, а Binance. Т.е. выбираете актив BTC, к примеру, но на бирже Binance. Не фьючерс, а спот.
Чем более большие обороты на бирже, по активу, и меньше возможностей заходить с плечами, тем менее волатильная цена и более красивый и точный график.
Работает на всех активах. Есть ограничение по подписке (количество рассчитываемых баров) мало влияет на что. Можно применить к любому активу где есть объем (не SPX, а ES1, не MOEX, а MX1!).
TechnicalRating█ OVERVIEW
This library is a Pine Script™ programmer’s tool for incorporating TradingView's well-known technical ratings within their scripts. The ratings produced by this library are the same as those from the speedometers in the technical analysis summary and the "Rating" indicator in the Screener , which use the aggregate biases of 26 technical indicators to calculate their results.
█ CONCEPTS
Ensemble analysis
Ensemble analysis uses multiple weaker models to produce a potentially stronger one. A common form of ensemble analysis in technical analysis is the usage of aggregate indicators together in hopes of gaining further market insight and reinforcing trading decisions.
Technical ratings
Technical ratings provide a simplified way to analyze financial markets by combining signals from an ensemble of indicators into a singular value, allowing traders to assess market sentiment more quickly and conveniently than analyzing each constituent separately. By consolidating the signals from multiple indicators into a single rating, traders can more intuitively and easily interpret the "technical health" of the market.
Calculating the rating value
Using a variety of built-in TA functions and functions from our ta library, this script calculates technical ratings for moving averages, oscillators, and their overall result within the `calcRatingAll()` function.
The function uses the script's `calcRatingMA()` function to calculate the moving average technical rating from an ensemble of 15 moving averages and filters:
• Six Simple Moving Averages and six Exponential Moving Averages with periods of 10, 20, 30, 50, 100, and 200
• A Hull Moving Average with a period of 9
• A Volume-Weighted Moving Average with a period of 20
• An Ichimoku Cloud with a conversion line length of 9, base length of 26, and leading span B length of 52
The function uses the script's `calcRating()` function to calculate the oscillator technical rating from an ensemble of 11 oscillators:
• RSI with a period of 14
• Stochastic with a %K period of 14, a smoothing period of 3, and a %D period of 3
• CCI with a period of 20
• ADX with a DI length of 14 and an ADX smoothing period of 14
• Awesome Oscillator
• Momentum with a period of 10
• MACD with fast, slow, and signal periods of 12, 26, and 9
• Stochastic RSI with an RSI period of 14, a %K period of 14, a smoothing period of 3, and a %D period of 3
• Williams %R with a period of 14
• Bull Bear Power with a period of 50
• Ultimate Oscillator with fast, middle, and slow lengths of 7, 14, and 28
Each indicator is assigned a value of +1, 0, or -1, representing a bullish, neutral, or bearish rating. The moving average rating is the mean of all ratings that use the `calcRatingMA()` function, and the oscillator rating is the mean of all ratings that use the `calcRating()` function. The overall rating is the mean of the moving average and oscillator ratings, which ranges between +1 and -1. This overall rating, along with the separate MA and oscillator ratings, can be used to gain insight into the technical strength of the market. For a more detailed breakdown of the signals and conditions used to calculate the indicators' ratings, consult our Help Center explanation.
Determining rating status
The `ratingStatus()` function produces a string representing the status of a series of ratings. The `strongBound` and `weakBound` parameters, with respective default values of 0.5 and 0.1, define the bounds for "strong" and "weak" ratings.
The rating status is determined as follows:
Rating Value Rating Status
< -strongBound Strong Sell
< -weakBound Sell
-weakBound to weakBound Neutral
> weakBound Buy
> strongBound Strong Buy
By customizing the `strongBound` and `weakBound` values, traders can tailor the `ratingStatus()` function to fit their trading style or strategy, leading to a more personalized approach to evaluating ratings.
Look first. Then leap.
█ FUNCTIONS
This library contains the following functions:
calcRatingAll()
Calculates 3 ratings (ratings total, MA ratings, indicator ratings) using the aggregate biases of 26 different technical indicators.
Returns: A 3-element tuple: ( [(float) ratingTotal, (float) ratingOther, (float) ratingMA ].
countRising(plot)
Calculates the number of times the values in the given series increase in value up to a maximum count of 5.
Parameters:
plot : (series float) The series of values to check for rising values.
Returns: (int) The number of times the values in the series increased in value.
ratingStatus(ratingValue, strongBound, weakBound)
Determines the rating status of a given series based on its values and defined bounds.
Parameters:
ratingValue : (series float) The series of values to determine the rating status for.
strongBound : (series float) The upper bound for a "strong" rating.
weakBound : (series float) The upper bound for a "weak" rating.
Returns: (string) The rating status of the given series ("Strong Buy", "Buy", "Neutral", "Sell", or "Strong Sell").

Point Of ControlStrategy and indicators are explained on the Chart.
Here's how i read the chart.
Entry:
1. Let the price close above the Ichimoku cloud
2. Price is above Volume Support zone
2. Make sure that momentum indicated with Green Triangles for Long Position
Exit:
1. Orange cross at the bottom of the candle indicates price is about to weaken
2. Best time to exit is Volume Resistance + Bearish(Hammer or Engulf )
PS: Use it along with R-Smart for better results

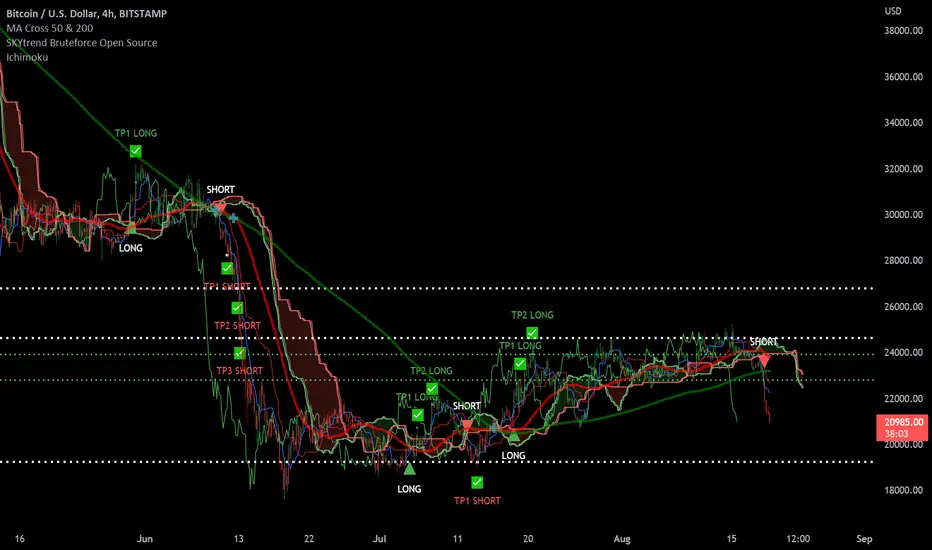
SKYtrend Bruteforce Open Source✨SKYtrend Bruteforce Now Open Source✨
📌This indicator analyzes the trend and calls Long/Short which is fully custom to fit your style of trading.
📌Custom Take Profit Levels currently have 3 TP levels for Long and Short you can decide which % each TP will be in settings.
📌2 Custom Stoploss levels. For Long or Short. Can Enable or Disable either.
📌Can set alert For Long, Short , TP Long 1-3, TP Short 1-3, SL 1-2
📌Has built in ichimoku cloud
If you like it, like it. :)
atnX_2According to the Ichimoku cloud, this script provides the opportunity to buy, sell, and determine the trend direction by signaling at the point where the EMA 5/10 intersections are located and gives you the opportunity to successfully indicate when you will exit the commodity that I like the most.
Investor_coin is my mentor to create such a well-working script.
@melihtuna did the coding.

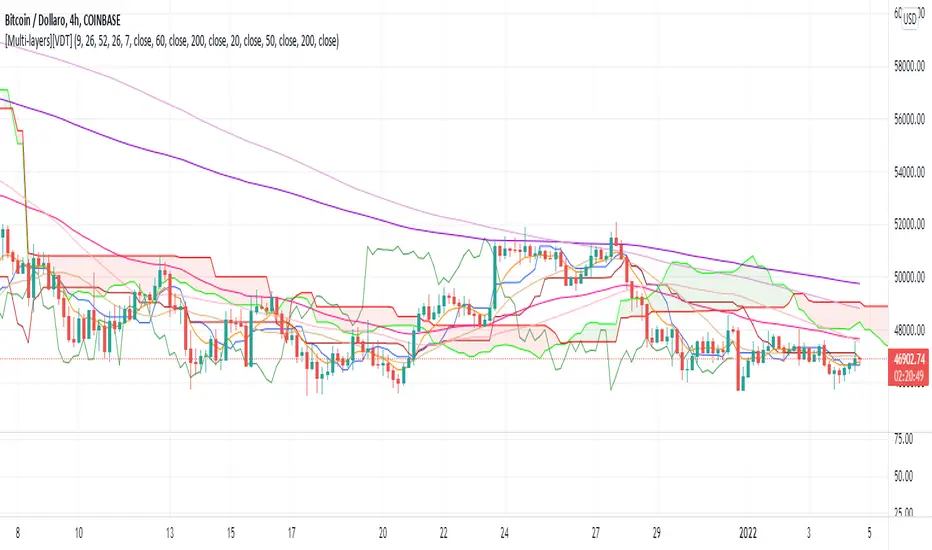
[Multi-layers][VDT]New multi-indicator to merge together three of the most popular indicators used by traders in technical analysis:
1) Ichimoku Cloud, with parameters editable by the trader. Default parameters are: 9-26-52-26
2) 3X Simple Moving Average (SMA), with periods editable by the trader. Default periods are: 20-50-200
3) 3X Exponential Moving Average (EMA), with periods editable by the trader. Default periods are: 7-60-200
Traders can decide whether to print or to hide each indicators separately in the graph, creating three different overlays.
T/K CROSSSimple crossing of the Tenkan & Kijun Sen indicated by a "Cross". Surfed Tradingview for it, but did not find it, so decided to make one. Does NOT include the Ichimoku Cloud & the Chikou
